In many ways, 2021 was a typical year for markets, but it also reinforced some basic market lessons that are hard to learn, even if they are not new. As we launch into the New Year, we’re highlighting three 2021 market lessons that we think may matter for 2022: 1) equity valuations are a poor timing mechanism, 2) structural forces have a large influence on interest rates and may keep them relatively low, and 3) politics and markets don’t mix.
Welcome to the New Year for markets, when year-to-date returns all reset to 0% and the year ahead is still a blank slate. No doubt, 2022 will provide its usual mix of ordinary market behavior and unexpected surprises. While these surprises can’t be forecasted, we can say with near certainty that we’ll have some. At the same time, markets have patterns that tend to repeat, even if the emphasis is different from year to year. As we head into the New Year, we’re taking a look back at 2021 and drawing out three lessons that we think will matter for 2022.
Valuations Aren’t a Short-Term Market Timing Mechanism
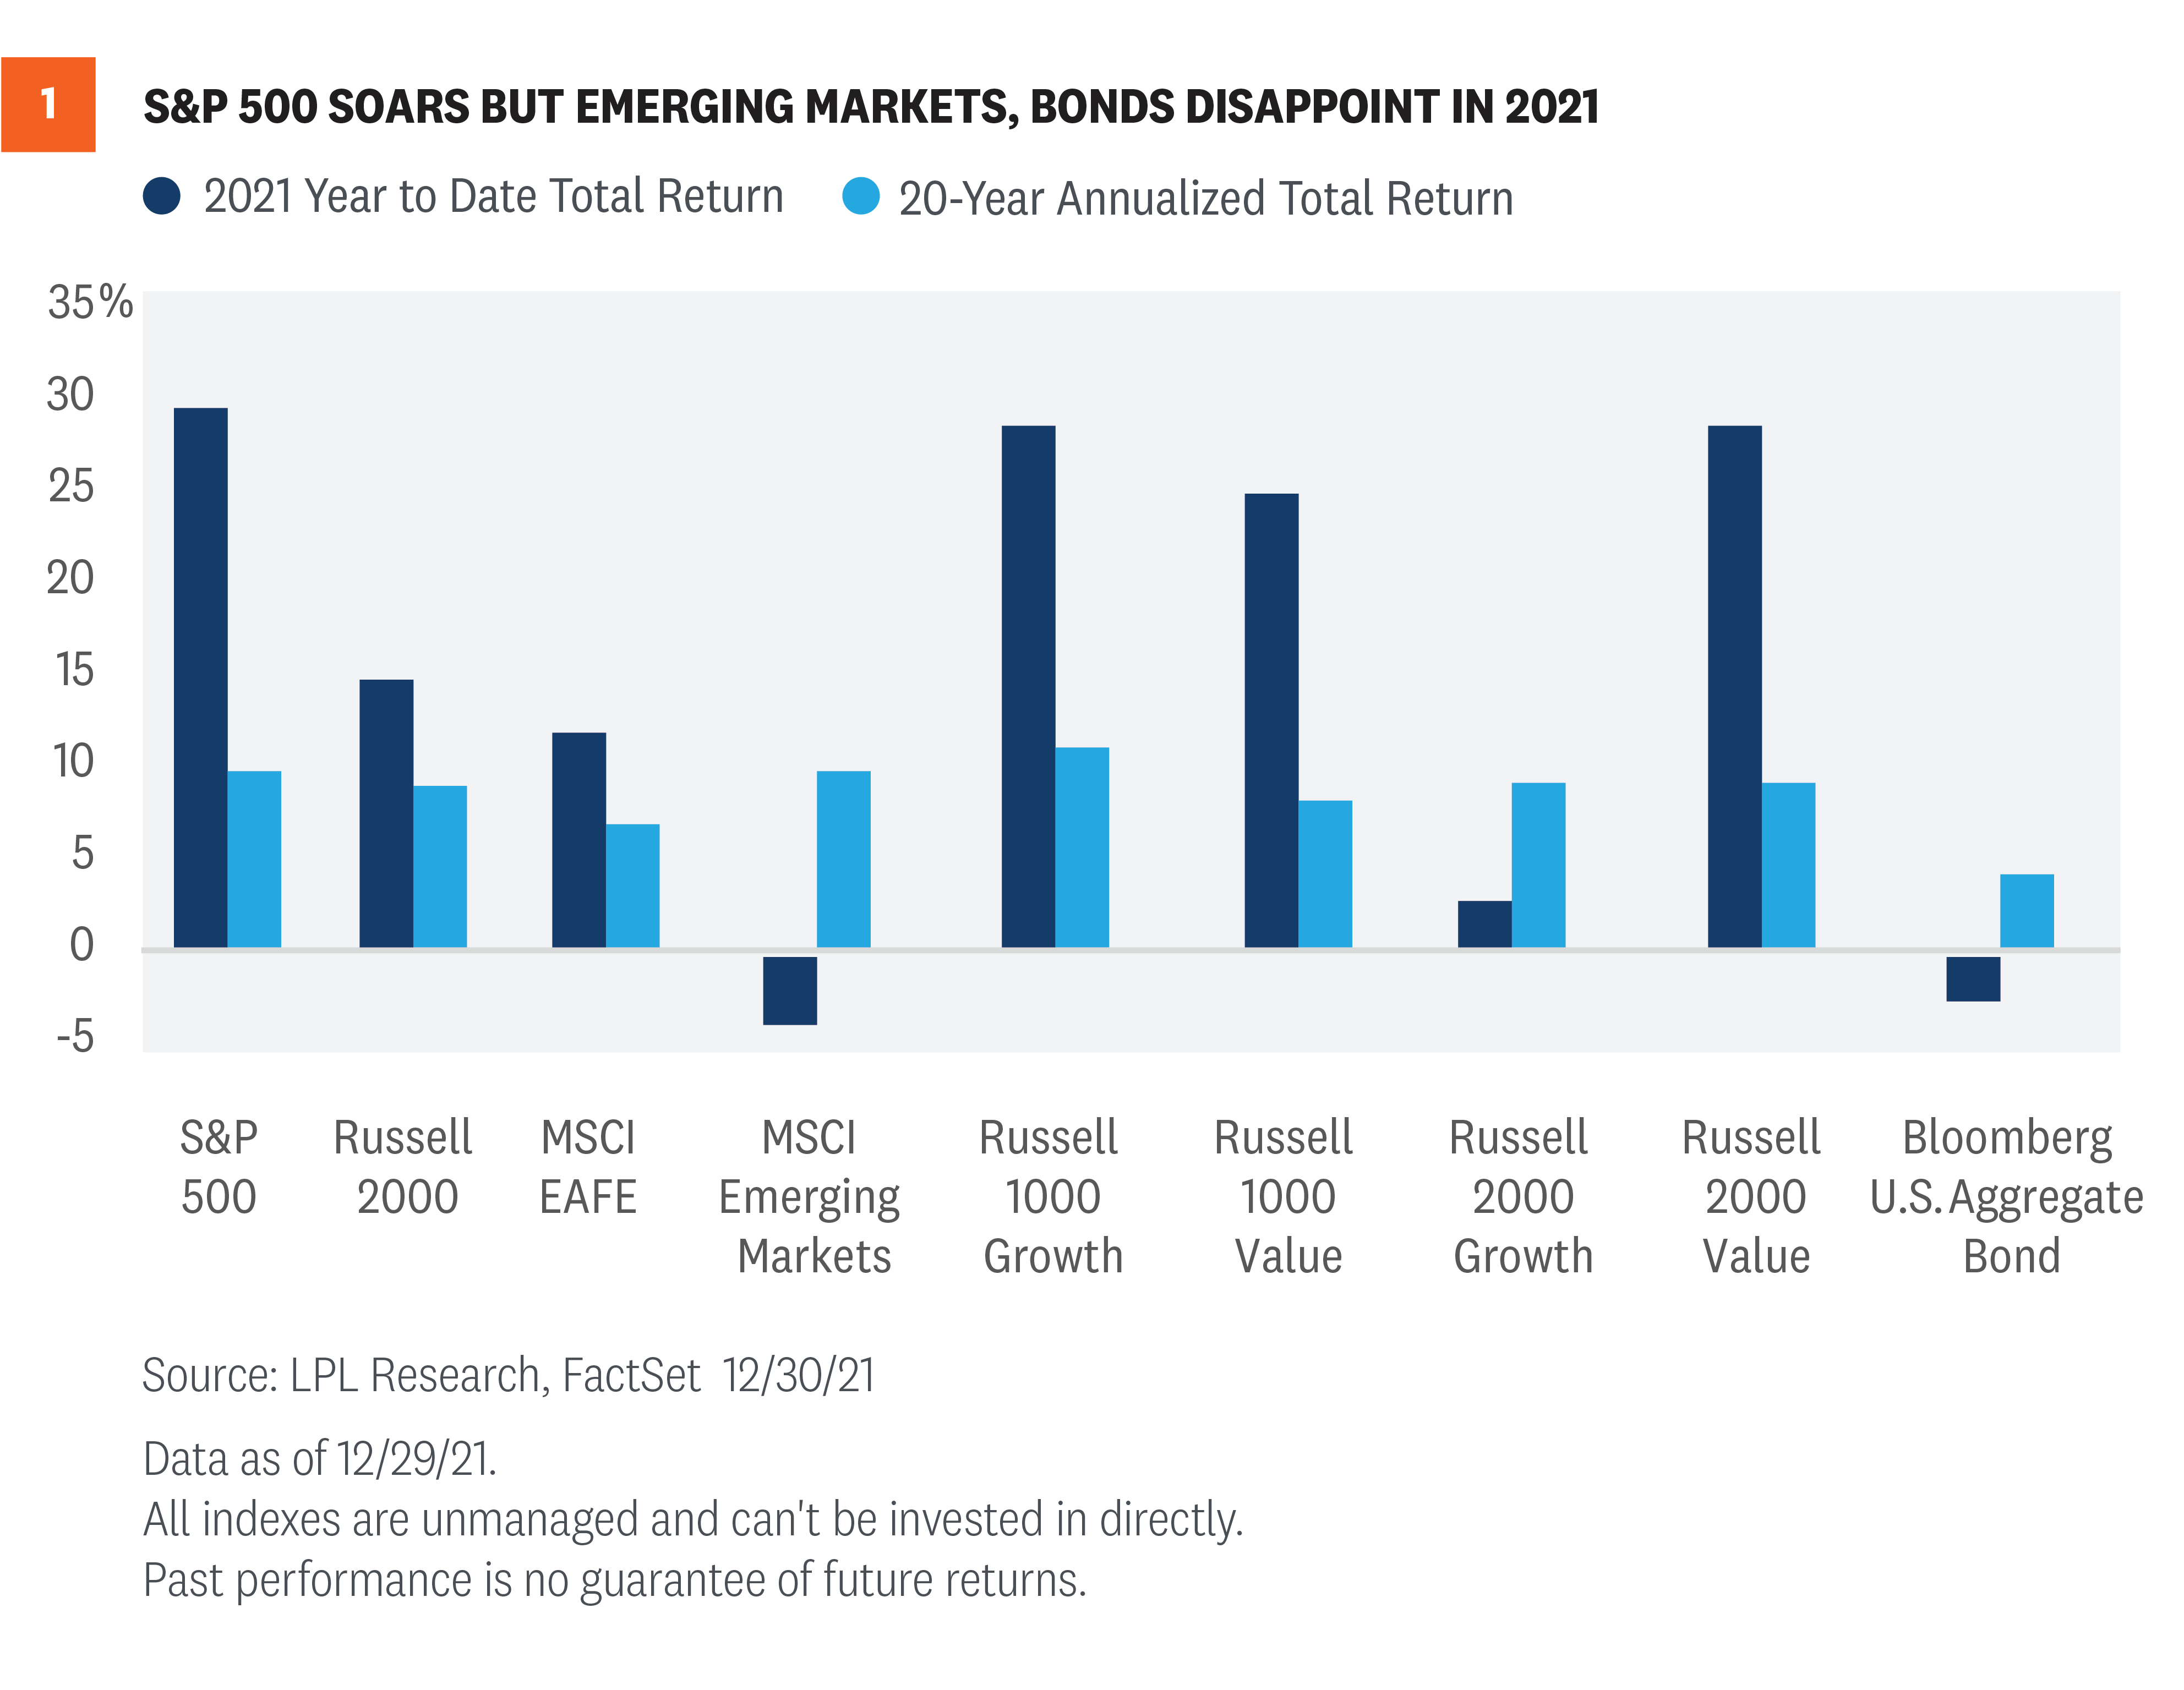
At the start of 2021 we heard concerns that broad U.S. markets were overvalued using many traditional valuation metrics, such as the price-to-earnings ratio (PE). In addition, compared to the U.S., international stocks (both developed and emerging markets) looked relatively cheap. But as shown in Figure 1, the S&P 500 surged higher in 2021, performing well above its historical average, while international equities lagged behind the U.S., with weakness in emerging markets in particular. Once again, valuations were a weak short-term timing mechanism.
At the start of 2021, the PE for the S&P 500 was historically elevated at almost 22.5 on forward earnings according to FactSet data. At the same time, interest rates were extraordinarily low, which makes stocks attractive relative to bonds and increases the present value of future earnings. On top of that, an extraordinarily strong year for corporate earnings helped stocks “grow into” their valuations, with the PE actually falling to nearly 21 by the end of the year despite strong stock market gains. Sentiment is often the primary culprit for allowing valuations to remain elevated, and it did play a role in 2021, but market fundamentals were even more important. If investors favored stocks in 2021, it was more about a sizable upside surprise in earnings growth than elevated optimism.
The underperformance by international equities this year, which may have surprised some, also reminds us that valuations are not a timing tool. International stocks have been more attractively valued than U.S. stocks for quite some time and yet, they’ve underperformed consistently for over a decade. We believe valuations should be used in combination with technical analysis, which helps measure both sentiment and captures collective market wisdom, to help inform investment decisions. Signals from the charts have helped us side-step some of that performance drag. Also, keep in mind that Europe and Japan are more value-oriented markets than the U.S., so growth-style leadership here at home makes it very difficult for these international markets to keep up.
We continue to favor the U.S. over developed international markets for 2022 because of the relatively healthier U.S. economic growth outlook and strong U.S. dollar, but international equities may become increasingly attractive as COVID-19 restrictions are removed globally.
Structural Forces Continue to Weigh on Interest Rates
If someone had told you at the start of 2021 that inflation (as measured by the Consumer Price Index) would be up close to 7% over the year while real gross domestic product (GDP) would grow near 5.5% and asked you where the 10-year Treasury yield would be at the end of the year, most market experts would likely guess well above the approximately 1.50% where we ended the year.
It’s true 2021, by many accounts, wasn’t a very good year for core fixed income investors—although that was largely to be expected. Coming into the year, interest rates were still amongst the lowest they have ever been and we thought they were headed higher—and they did. As such, returns for core fixed income investors, as measured by the Bloomberg U.S. Aggregate Bond Index, were negative for the year for only the fourth time in the index’s history dating back to 1976.
However, after a 70 basis point (0.70%) increase in the 10-year Treasury yield by mid-March, which led to one of the worst starts to the year ever for core bonds, yields have largely remained range bound. One of the main reasons interest rates have stayed as low as they have this year was the amount of foreign interest in our markets. Despite relatively low yields in the U.S., many foreign investors are still better off investing in U.S. fixed income markets. With approximately $13 trillion in negative yielding debt globally (it’s still crazy to think that you have to pay a country/company to own its debt), even modestly positive yielding debt is an attractive option. This has certainly helped keep interest rates from moving significantly higher—a likely headwind to higher rates in 2022 as well.
So what is the key takeaway from 2021? Despite increased inflationary pressures not seen since the 1980s (when 10-year Treasury yields averaged over 10% for the decade), there is still a huge global demand for safety, income, and liquidity in portfolios and that has kept interest rates (and spreads) from moving much higher. While yields for U.S. core fixed income may seem low, the role it plays in portfolios is still an important one.
Politics and Investing Don’t Mix
This is one lesson we likely knew before the year began, but 2021 provided another strong example of why politics and investing don’t mix, both for broad markets and for the market impact of more specific policy.
For example, when President Biden was elected, one of the sectors most expected to suffer was traditional energy. The bear case for energy was that Democratic policies towards fracking and the fossil fuels industry would further harm one of the worst performing sectors over the past decade. In contrast, the solar industry was expected to benefit from an acceleration towards renewable and clean energy sources.
Well, what happened? The complete opposite. The S&P 500 Energy Sector was by far the top performing sector of the year, up more than 50%, while the MAC Global Solar Energy Index, a basket of stocks focused on solar energy, fell nearly 30%. And this isn’t the only time in recent history we have seen the energy sector returns upend traditional thinking. When President Trump was elected back in 2016, the two consensus sector winners from his presidency were expected to be energy and financials due to deregulation. However, from the date of the 2016 Presidential election to the 2020 election, energy stocks were cut in half while the financials sector returned less than half that of the broader market. Forecasters had the policy right and the business impact was generally as expected, but nevertheless it seemed small from a pure market perspective compared to other drivers influencing sector returns.
Speaking more broadly, stocks have done extremely well over the past decade, with little regard or correlation to which party has held the White House or Congress, and we believe investors would do well to remember that in 2022 as midterm elections begin to dominate the news cycle. It’s not that policy prognostications are incorrect or that policy doesn’t matter. Rather, when it comes to markets there are larger economic forces in play that typically matter a lot more.
What Lies Ahead in 2022
We do not expect 2022 to simply be a repeat of 2021. We’ve moved further toward the middle of the economic cycle, inflation is likely to decrease rather than increase, and economic momentum will probably slow. But perhaps most importantly, the policy support from central banks and governments that have helped global economies bridge the economic fissures left by COVID-19 will likely begin to fade, leaving the economy to stand increasingly on its own two feet while putting more emphasis on the aggregate decisions of businesses and households. (For a broad overview of our expectations for 2022, see our Outlook 2022: Passing the Baton.) But for all the differences, we expect some important lessons learned in 2021 to matter in 2022, and as the year evolves we’ll continue to monitor and share the market signals that will help shape the market environment in the New Year.
Click here to download a PDF of this report.
______________________________________________________________________________________________
IMPORTANT DISCLOSURES
This material is for general information only and is not intended to provide specific advice or recommendations for any individual. There is no assurance that the views or strategies discussed are suitable for all investors or will yield positive outcomes. Investing involves risks including possible loss of principal. Any economic forecasts set forth may not develop as predicted and are subject to change.
References to markets, asset classes, and sectors are generally regarding the corresponding market index. Indexes are unmanaged statistical composites and cannot be invested into directly. Index performance is not indicative of the performance of any investment and does not reflect fees, expenses, or sales charges. All performance referenced is historical and is no guarantee of future results.
Any company names noted herein are for educational purposes only and not an indication of trading intent or a solicitation of their products or services. LPL Financial doesn’t provide research on individual equities.
All information is believed to be from reliable sources; however, LPL Financial makes no representation as to its completeness or accuracy.
U.S. Treasuries may be considered “safe haven” investments but do carry some degree of risk including interest rate, credit, and market risk. Bonds are subject to market and interest rate risk if sold prior to maturity. Bond values will decline as interest rates rise and bonds are subject to availability and change in price.
The Standard & Poor’s 500 Index (S&P500) is a capitalization-weighted index of 500 stocks designed to measure performance of the broad domestic economy through changes in the aggregate market value of 500 stocks representing all major industries.
The PE ratio (price-to-earnings ratio) is a measure of the price paid for a share relative to the annual net income or profit earned by the firm per share. It is a financial ratio used for valuation: a higher PE ratio means that investors are paying more for each unit of net income, so the stock is more expensive compared to one with lower PE ratio.
Earnings per share (EPS) is the portion of a company’s profit allocated to each outstanding share of common stock. EPS serves as an indicator of a company’s profitability. Earnings per share is generally considered to be the single most important variable in determining a share’s price. It is also a major component used to calculate the price-to-earnings valuation ratio.
All index data from FactSet.
This research material has been prepared by LPL Financial LLC.
Securities and advisory services offered through LPL Financial (LPL), a registered investment advisor and broker-dealer (member FINRA/SIPC). Insurance products are offered through LPL or its licensed affiliates. To the extent you are receiving investment advice from a separately registered independent investment advisor that is not an LPL affiliate, please note LPL makes no representation with respect to such entity.
Not Insured by FDIC/NCUA or Any Other Government Agency | Not Bank/Credit Union Guaranteed | Not Bank/Credit Union Deposits or Obligations | May Lose Value
RES-994650-1221| For Public Use | Tracking # 1-05227512 (Exp. 1/23)